
The effect of Income on motivation to vaccinate -empirical check
- Asher Idan
- Dec 9, 2021
- 4 min read
Updated: Dec 19, 2021
this is part-2 of that article
Empirical evidence
The data in this section are from the Israeli central bureau of statistic and the Israeli social security service.
The data consists of 280 cities in Israel. Nine cities in the data set are Bedouins tribes’ observations that were missing some data was removed. An additional five cities were removed due to missing information of interest. For the rest of 266 cities the following data were collected:
Percentage of vaxers out of vaccinable population
The main interest of the study is the effect of income on vaccination. Thus, the most important dependent variable is the percentage of vexers out of the vaccinable population. Because the Israeli government prioritize the higher age groups to receive the vaccine first, the data best represent the percentage of vaccination from vaccinable population and only after the entire population that can received the vaccine did.
Although, when considering measuring the amount of population that accept the vaccine, the different dosage should be considered. Since it takes time to vaccinate the entire population, the study focuses on the vaccinatable population of the first dose. The main idea behind this decision is to capture the most accurate percentage of people who accept to participate in the vaccination and not to measure the actual percentage of immune out of the public. The data is updated to 20 Nov 2021, which I believe is enough time for the vast majority of the population who want to participate to do so.
The data came from the website of the ministry of health and the Central Bureau of Statistic website. Both origins where merge to generate the desired dependent variable which is dividing the amount of vaxers in the first dose by the number of vaccinable population (calculated based on age).

Income of employee
The first regressor in our model definitely should be the income, as the theoretical model suggests. Since we use aggregated data on different cities, the income available to us is the average income of employees in that city. The data was collected from the Israeli social security website at the same week of the rest of the day was collected and it’s updated to the end of September.
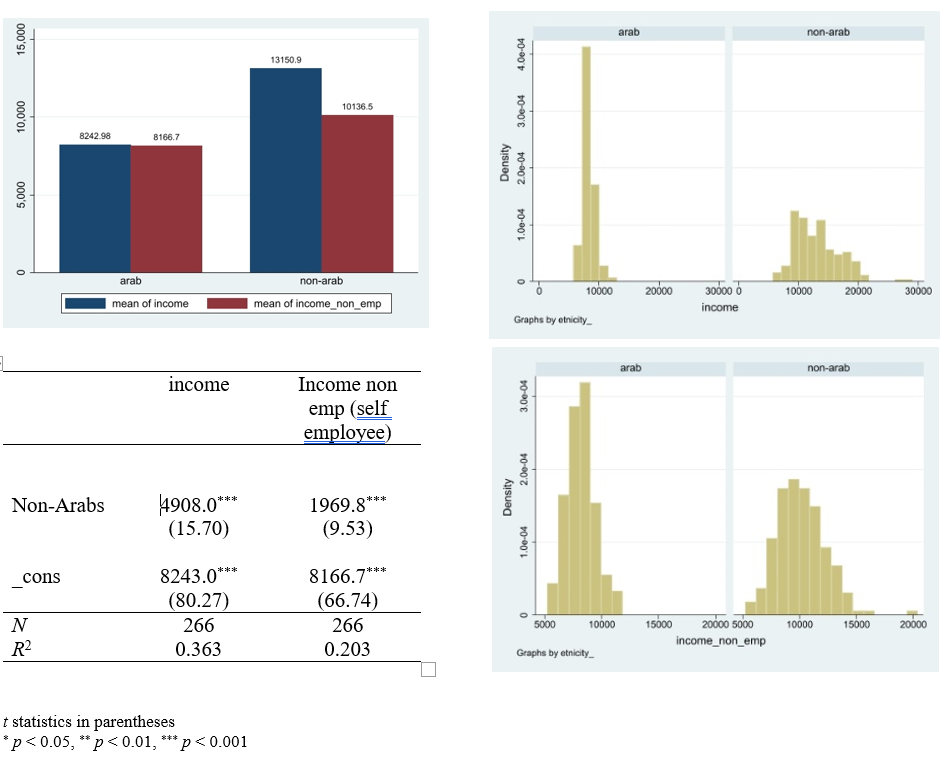
As shown in the figures, the difference income between Arab and non-Arab cities is significant for income of employed and for self-employed to. The difference between two types of income is different among non-Arab but similar among Arabs.
A regression with dependent variable of income and dummy variable for non-Arab is introduced in table above. Both regressions are highly statistically significant.
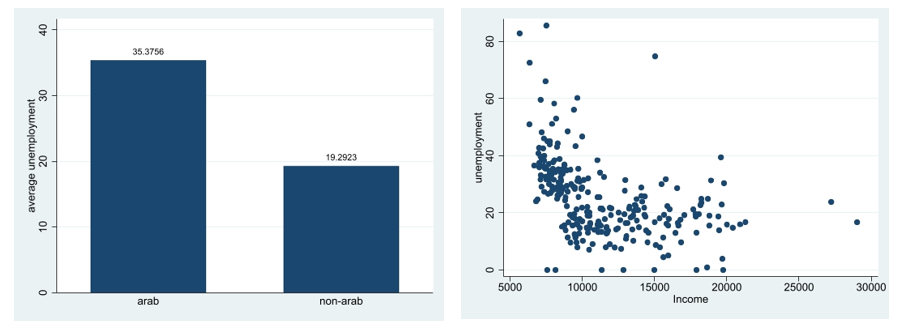
Unemployment
Since income and unemployment are strongly correlated, an additional regressor which is of interest is unemployment. One can easily notice the reciprocal relation of income and unemployment in a scatterplot.
The unemployment rate is calculated as the difference between the workforce size to the number of employees, divided by workforce.
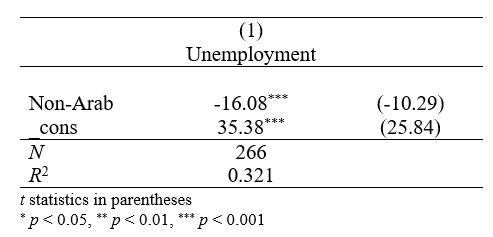
A summary statistic of unemployment is follows
Additional regressors
Some additional regressors which were added to the model: Population, social security inability tax and the city count which it belongs to.
Population-
Population, or actually the log of it, was introduced to the model to capture the effect of big metropolitans or a small city. One may assume that size of cities is more likely to have negative effect on vaccination if for example he thinks that the bigger the size is the bigger the chance to get infected from someone, which provide an incentive to vaccinate.
Another option is that the bigger the city, the most likely it to have good infrastructure which help for effective vaccination operation. thus, to have a positive effect.
Which one is more likely? is hard to say a priori. Whatever the result will be, the more important thing is that city size captures some other factors that can be put directly into the model. Thus, I ‘m not so sure about the magnitude nor the sign of city, nor its significance. But, if it is significant, the reason to keep it in the regression is obvious from a statistical perspective so estimation of interested regressors is more accurate.
social security transfer receivers-
A special interest lies in the social security transfer receivers.
Social security transfer may be given due to one or more reasons of illness. The illness may be due to mental, physical or both.
The negative correlation of income and social security receivers indicate that social security receivers (as percentage) are a measure of low social economic factor. I assume that as city have more social security receivers, the number of receivers should be negative correlated with vaccination.
Dummy for city count and for ethnicity-
As dummy for ethnicity may seems obvious to understand the differences between Arabs and non-Arab’s cities in Israel, the count of the city which it belongs to is less intuitive, and for good reason. The main reason for that is to capture local effect that may be related to geographic features, but most important is to have a better estimation of the effect of regressors under interest.
Education-
Another dimension of socioeconomic to consider is educational status of the subjects. One may expect to a positive correlation with vaccination percentage, but unfortunately the lack of information pushing us to consider only a proxy variable so a better estimation of income. Since only a proxy variable of percentage of high education out of 30 to 55 population is at hand, one should not interpret this proxy variable at all.
An additional proxy for education I used is the percentage of full maturity receivers out of graduates.
In addition, due to lack of information the education variable is available to only 210 cities among the study. Thus, an imputation based on income was made for both proxies.
regression
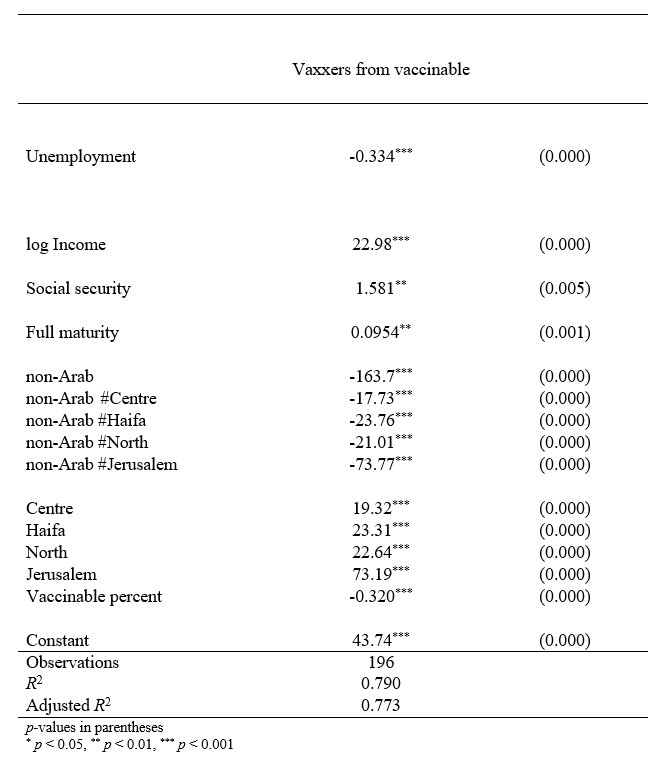
As expected, the log of Income is significant and positive. Using dummy variable on log income did not provide significant differences between non-Arabs and Arabs. In different estimation of the regression the log income coefficient has ranged from 15 to 22, while small coefficients are more likely to be when using imputation of the rest of the data, I suspect in attenuation bias.
The population has fallen due to insignificant, while unemployment has stayed constantly negative and significant. So as full maturity which was always positive significant. Vaccinable from population has used as control for the amount of population that should have been vaccinate, provide a significant negative coefficient.
Comments